
A flowchart is a type of diagram that is often used to represent the flow of a process. It should usually lead us to the best decision, for the process to be fully accomplished. It is also a great way to show through a diagram the dependence of the different phases of that process, but also how things would change if some parameter was changed.
This is why it is often called process chart, flow diagram, process map, functional chart, and many other similar names. It is often used to analyze the quality of a process. The elements of the diagram represent various sequences of actions taken or resources invested, with some acting as input and others as output. The links between them are actually the decisions that need to be made to optimize that process.
As a tool, flowcharts are often used to improve understanding of a process, find ways to improve it, introduce transparent communication, record changes, and plan the next phase of a project.
At zenflowchart.com you can find a lot of useful information related to the symbols used. Once you learn their meaning, it will be really easy to apply this method yourself.
You have probably already noticed that there are different rectangular shapes, circles, triangles, arrows, and different directions. Sometimes their shapes show what part of the process it is.
However, these symbols can also be adapted, depending on how the team in the company decides. It is always good to explain in a part of the presentation what the symbols actually mean so that even those who are new to this concept can understand you.
Table of Contents
Why is it important to use flowcharts?

Source: blog.anant.us
If your goal is constant progress and following the trends, these charts can be a great tool for you to do it successfully. That way you can easily assess at what stage of the process something new needs to be implemented.
When we have a visualization of what is happening, it is very easy to adapt to the conditions and improve the efficiency both personally and the whole team.
Flowcharts can be very helpful in improving productivity. They are used in almost every industry and often help you to understand ideas better. In this way, you are actually helping your business to be profitable. You can also keep your business up to date.
In which situations is a flowchart used?
This diagram allows you to control the workflow. In this way, you actually document and visualize the ideas. It is a good idea to save the initial plan so that you can upgrade it later. In doing so, it will be very easy for you to make decisions and organize employees according to their work tasks.
You can also standardize the workflow, if possible, but also identify challenges and potential obstacles before they even occur.
Throughout the procedure, you can monitor progress and, if necessary, adapt things according to priorities and the new situation.
Teamwork will help resources to be properly distributed, and also all participants to understand their tasks. They also need to see how their individual tasks depend on each other. As the name of the diagram itself says, this will help the work to flow nicely and easily.
How are the symbols named?
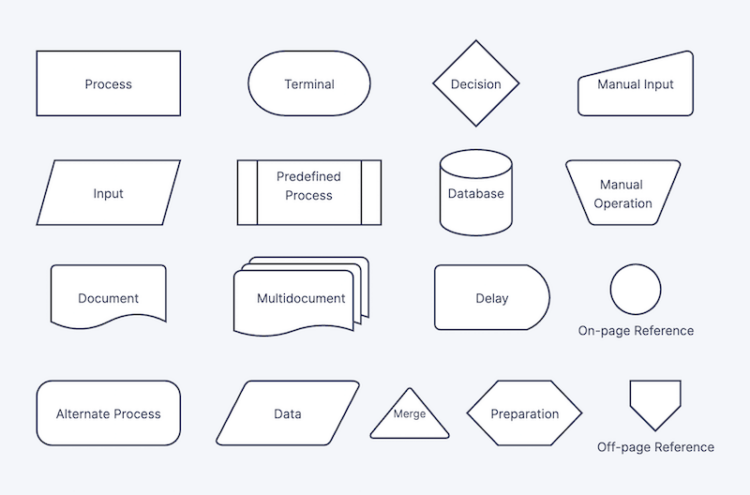
Source: zenflowchart.com
There are many symbols. For example, a flowline is a directional line that shows how different blocks of a diagram are dependent on each other. Terminator represents the beginning and end of a flowchart. The square is usually the process itself. At each stage, you can add a comment or additional information related to the process.
There are also symbols that have different shapes, which indicate decisions, data, documents, delays, manually entered input, and many more.
As we said, these symbols are standardized, but not mandatory to use. Anyone who makes a flowchart can define their own symbols and use them appropriately.
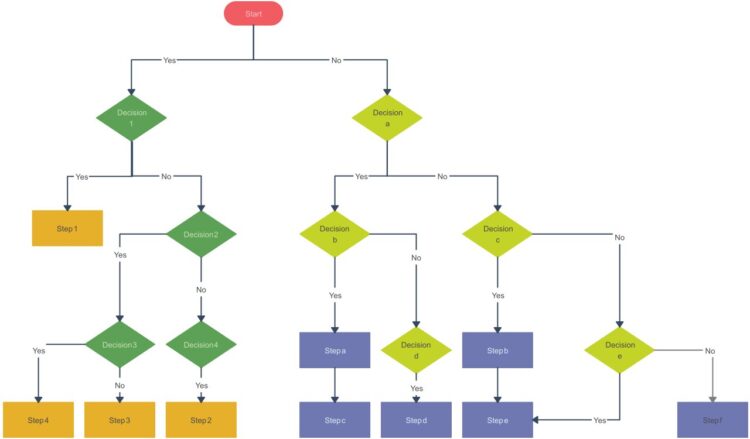
What kinds of flowcharts are there?
Several basic forms and principles are used in business. For example, you can use a decision flowchart, which will shorten the decision-making process. A logic flowchart is useful to prevent possible problems, but also to notice in times when things are not as they should be. System flowcharts are actually the most useful way to see for yourself how data depends on each other. Product visualization is used in production while defining the production process.
However, there is a procedure that you need to define yourself, and its standard form is:
– Defining the purpose of the process
– Chronological order of events
– Organizational structure
– Drawing the diagram
– Prediction of outcomes
Resources and new decisions can be added. Of course, it is good to know that when running a complex process, the diagram can be chaotic, so it is good to optimize the process.
Can you use templates?
Source: creately.com
Templates are good when a process is short, defined, and clear from the initial stages. But if there is a possibility of big changes, there is no big benefit from using templates. However, it is these guidelines that can help you to understand the challenge yourself, define the goals and then commit to the full implementation of the process.
Our advice is to always try to create a flowchart yourself because each work process is unique and has specific details that are not in the templates.
Conclusion
From all that we have said so far, we can conclude that flowcharts are finding their place in the business world. Although this is a method you may have used in school, just think how useful it was for you to make decisions and understand the material more easily. Then why not make your job easier? Just think how much time and resources you would save if you defined the processes from the beginning and were prepared for any possible outcome or problem you would face.
We hope that this article will motivate you to embrace the flowcharts as an integral part of your workflow planning. It will lead your team to exceptional results too.